Crypto Weekly Market Update – April 27, 2026
By ethio – Weekly Crypto Insights from Addis Ababa

Important Disclaimer: This is not financial advice. Cryptocurrency is extremely volatile and carries significant risk of loss. Always do your own research (DYOR), only use capital you can afford to lose, and consider your risk tolerance. Past performance does not predict future results. No guarantees or predictions are made here.
April 2026 has seen Bitcoin recover from early-month lows near $65K–$70K (amid lingering US-Iran geopolitical tensions and risk-off flows) to trade firmly above $78,000. A temporary ceasefire in the Middle East provided some relief, though tensions persist with reports of frozen Iran-linked crypto assets and ongoing diplomatic friction. Renewed institutional buying via spot Bitcoin ETFs (strong inflows in recent weeks) has supported the bounce, helping flip year-to-date ETF flows positive. Broader risk sentiment remains cautious, with crypto still behaving partly as a high-beta risk asset correlated with equities.
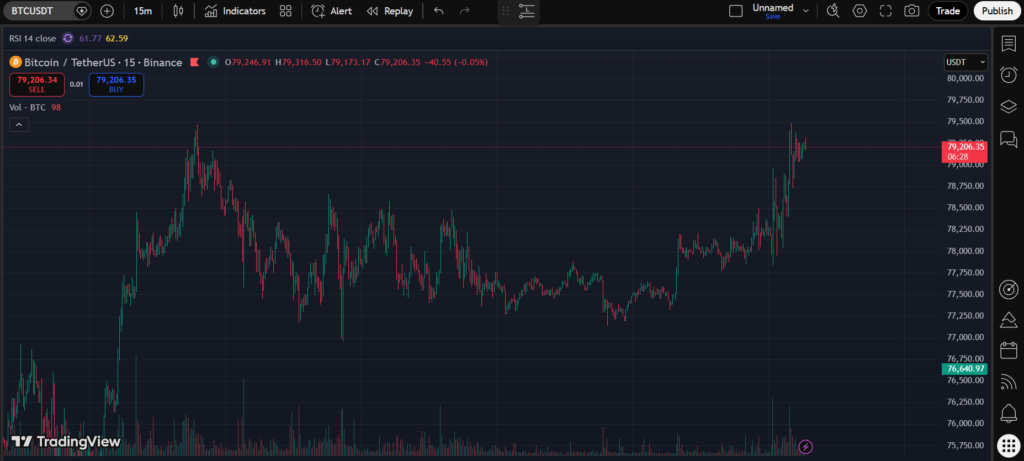
Quick Market Snapshot (as of April 27, 2026 ~ early morning)
- Bitcoin (BTC): $78,200–$79,200 (up 1–2% in the last 24h; consolidating after testing $78K–$80K resistance)
- Ethereum (ETH): $2,350–$2,380 (modest gains, slightly outperforming in spots but still lagging BTC YTD)
- Total Crypto Market Cap: $2.6–$2.7 trillion (up modestly week-over-week, reflecting BTC-led recovery)
- Top performers (recent 24–48h context): Selective alts showing bounces; majors consolidating with BTC dominance holding strong (58–60%).
- YTD context: BTC down 10–20% from 2026 highs (improved from deeper drawdowns earlier); ETH similarly pressured but showing resilience.
The recent rally has been supported by ETF inflows and short-covering rather than explosive retail buying, with macro and geopolitical factors still capping upside.
Key News & Drivers This Week
- Geopolitical situation: US-Iran tensions continue with a shaky ceasefire backdrop. Recent US actions include freezing ~$344M in Iran-linked crypto assets. Oil price volatility and risk-off sentiment have eased somewhat but remain headline risks.
- ETF flows turn positive: Spot BTC ETFs have seen strong inflows in April (e.g., multi-day streaks totaling billions recently, led by BlackRock’s IBIT), helping reverse earlier 2026 outflows and supporting price recovery. Cumulative inflows now back in positive territory YTD.
- Macro rotation: Crypto continues to show elevated correlation with equities (high-beta behavior in risk-on/off moves). Fed signals, inflation data, and broader liquidity remain key watches.
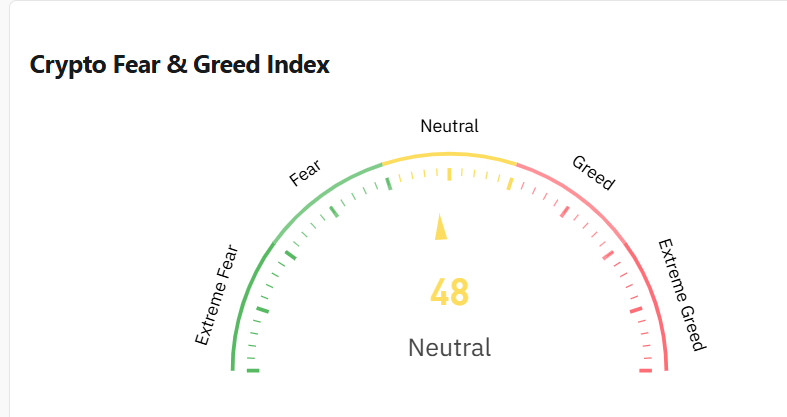
- Sentiment: Crypto Fear & Greed Index has improved from Extreme Fear levels (low teens/20s earlier in April) to the **Fear/Neutral zone (~40–48 recently). This shift signals reduced capitulation but not yet strong greed.
- April/May events watch: Ongoing policy data, potential regulatory clarity (e.g., Clarity Act progress), and any further Middle East de-escalation or escalation could drive volatility.
Technical Analysis Snapshot
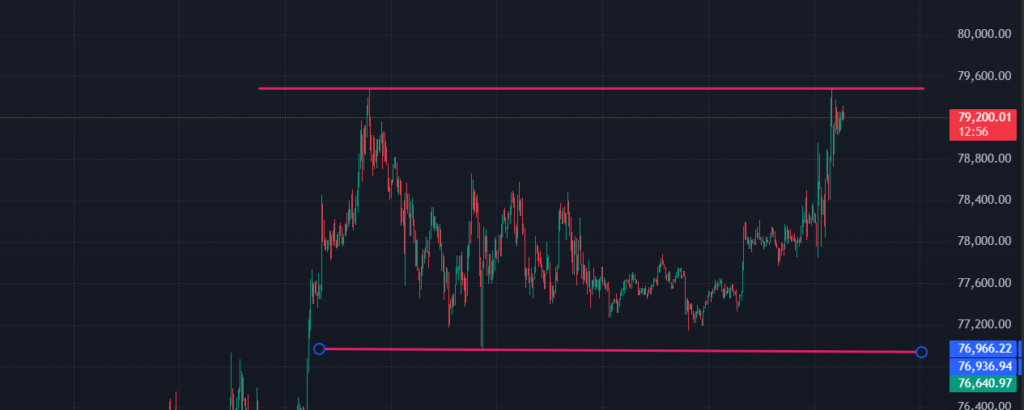
Bitcoin rejected the $80K+ zone recently but has reclaimed higher ground above the 200-day MA ($72K area, now acting as support).
- Support Levels: $74,000–$76,000 (near-term), $72,000 (200-day MA), $70K psychological.
- Resistance Levels: $79,000–$80,700 (short-term holder cost basis / recent highs), $85K+ overhead.
- Pattern Watch: Recovery from early-April lows; ascending structures possible but macro risks keep it range-bound/choppy. Oversold conditions have eased, yet RSI (14) on daily/weekly frames suggests room before overbought territory in many cases. Ethereum holds near $2,300–$2,400 but remains vulnerable in broader risk-off phases.
Trend & Moving Averages (common periods):
- 50-period MA: Short-term trend gauge (often dynamic support/resistance).
- 100-period MA: Intermediate trend.
- 200-period MA: Long-term trend (currently supportive for BTC around $72K).
BTC is trading above its 200-day MA, indicating a potential shift from deeper bearish structure earlier in 2026.
Relative Strength Index (RSI, 14-period):
- Bullish signal when RSI < 30 (oversold, potential bounce).
- Bearish signal when RSI > 70 (overbought, potential pullback).
Current readings for majors are generally neutral-to-mildly bullish post-recovery (not yet extreme).
- On-Chain & Sentiment Insights
- ETF inflows and institutional accumulation have provided a bid, contrasting earlier outflows.
- Leverage/funding rates have normalized somewhat after prior squeezes.
- Whale activity and miner metrics show mixed signals amid ongoing stress but with signs of stabilization.
- Sentiment: Improved from capitulation lows but still cautious due to geopolitics and macro headwinds.
- Probability of Trading Scenarios for the Coming Week
Hypothetical only
- Bullish short-term relief: Clean break and hold above $79K–$80K on strong volume + positive macro/geopolitical news → targets $85K+. ETH/BTC outperformance could signal broader rotation.
- Bearish continuation: Rejection at $80K+ with renewed selling (geopolitics flare-up, equities weakness) → retest $74K–$72K or lower. Monitor ETF flows daily.
- Most likely near-term: Choppy consolidation $74K–$80K with volatility spikes on headlines. Scalp bounces/rejections with tight stops.
What I’m Watching Next Week:
- Any further developments or de-escalation signals on US-Iran/Middle East situation.
- ETF flow continuation vs. reversal.
- Fed/economic data and equities/oil reaction (crypto often moves with risk sentiment).
- On-chain signals strengthening or weakening.
April has been pivotal with recovery attempts, but current action still calls for caution: rallies remain fragile, and downside risks from macro/geopolitics are real.
List of Top 5 Crypto Coins with Good Recent Performance and Potential to Go Up in the Coming Week
(Selected based on recent momentum, narrative strength, and technical setups in the current BTC-led environment. These are not recommendations — volatility is high; DYOR and manage risk.)
- Bitcoin (BTC) — Core leader with ETF support and recovery above key MAs.
- Ethereum (ETH) — Showing relative resilience; potential for outperformance if rotation begins.
- Solana (SOL) — High-performance layer-1 with ecosystem activity; often moves with beta to BTC.
- BNB — Strong performer among majors in recent periods; benefits from Binance ecosystem.
- XRP — Regulatory clarity tailwinds historically supportive; selective bounces noted.
Crypto Coins with High Beta and Strong Correlation to Bitcoin
High-beta alts (typically beta >1.0–1.5+) amplify BTC moves (e.g., 1% BTC move → larger % alt move) while maintaining strong positive correlation (close to +1.0 over 30–60 days). These are often layer-1s, AI/DeFi, or high-volatility ecosystem tokens. Common examples in current market include:
- Solana (SOL)
- Avalanche (AVAX) or similar high-throughput L1s
- Bittensor (TAO) or AI-related plays (narrative-driven beta)
- Render (RNDR) or GPU/AI infrastructure tokens
- NEAR Protocol (NEAR) or other scalable alts
(Exact beta/correlation values fluctuate; in practice, traders reference tools like Binance, TradingView, or analytics platforms over 30/60/90-day periods to quantify. High-beta coins rise harder in BTC pumps but crash more sharply in dumps.)
Trend & Moving Averages note: Use 50/100/200-period SMAs or EMAs on your preferred timeframe (daily for swing, 4H for short-term) to assess alignment with BTC’s trend. RSI (14) helps spot oversold (<30) entries or overbought (>70) caution zones.
I hope it helps you. If you have any comment or suggestion, or any topic you want me to cover in next week’s article please let me know in the comment section. Stay safe, See you next week.